Static Code Analysis for Unity3D — Part 2
- 2 minutes read - 410 wordsThis article is in continuation of Static Code Analysis for Unity3D — Part 1 where we talked about setting up a local sonar server, sonar scanner and running the analysis for a Unity3D project.
It this article, we will discuss setting up the Static Code Analysis with SonarCube in IDE — Rider. We are using Rider as the “External Script Editor” in Unity. Configure Rider here in Unity> Preferences > External Tools > External Script Editor.
Install SonarCube Plugin For Rider
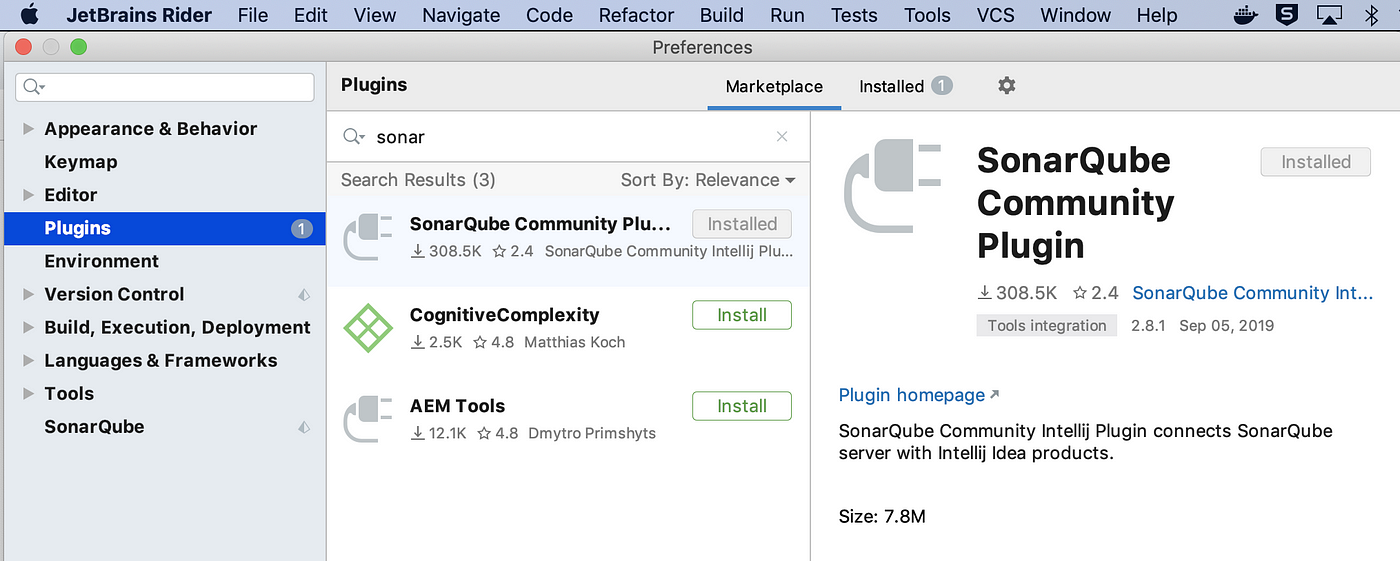
- Go to JetBrains Rider > Preferences > Plugins > Marketplace > Search SonarQube
- You will find “SonarCube Community Plugin” > Click Install.
- It will ask you to restart the IDE to complete the installation. On successful restart you should see it installed.

Configure SonarCube Plugin
We need to connect to the sonar server, to perform local analysis. Here are the steps to follow.
-
Go to JetBrains Rider > Preferences > SonarQube — Click Add and provide details of the local sonar server. Ref to the previous post for more details.

-
Click on +icon for SonarQube resources
-
Click Download Resources and Select the Sonar Project that we have added. — UnityFirst

-
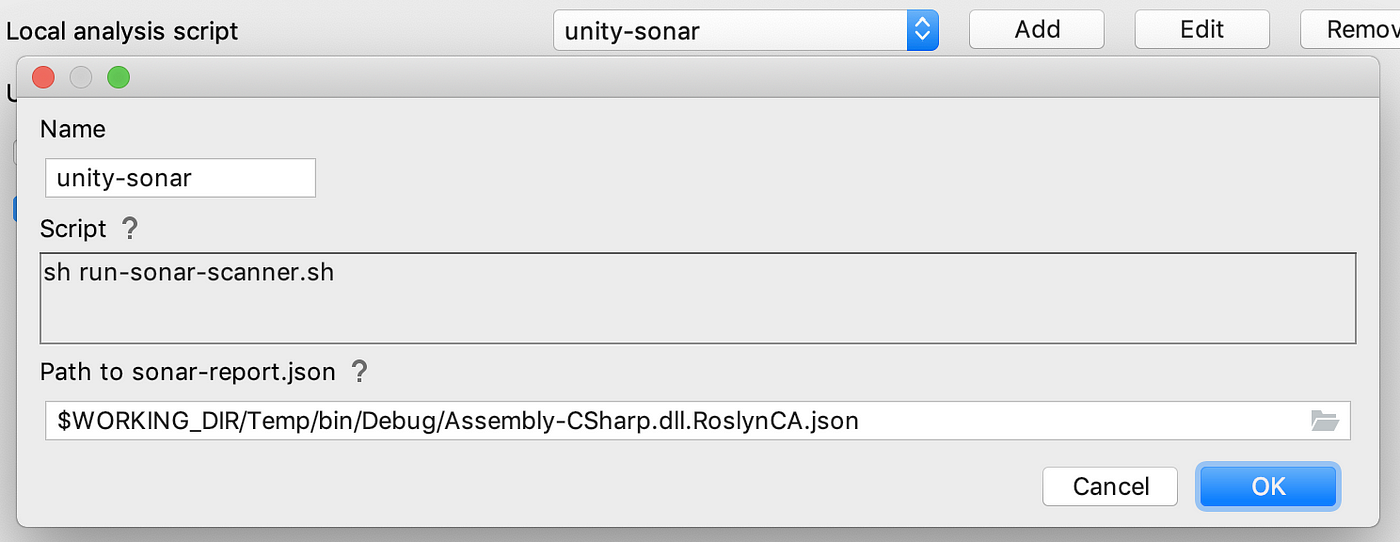
For local analysis, we need to provide local script that will be called when ‘Inspect Code’ is performed on IDE. So create a script as follows covering all 3 steps that we discussed in the last post.
-
Add Local analysis script — give it a name, path of script and output file.

We are now ready to analysis the code.
Static Code Analysis in Rider
Open the unity project in Rider. We have ButtonController.cs created in last post, let’s analyze that.
-
Go to JetBrains Rider > Code > Run Inspection By Name (Option+Command+Shift+I) > Search for Sonar
-
Select “SonarQube (new Issues)” > Select Inspection Scope as Whole Project


-
It will run the code analysis. Just like we did in from the command line in the last post.

-
To analyze the issues inline in the files, Go to JetBrains Rider > Code > Run Inspection By Name (Option+Command+Shift+I) > Select “SonarQube” > Select Inspection Scope as Whole Project

-
Issues are available in Sonar Inspection windows and inline.
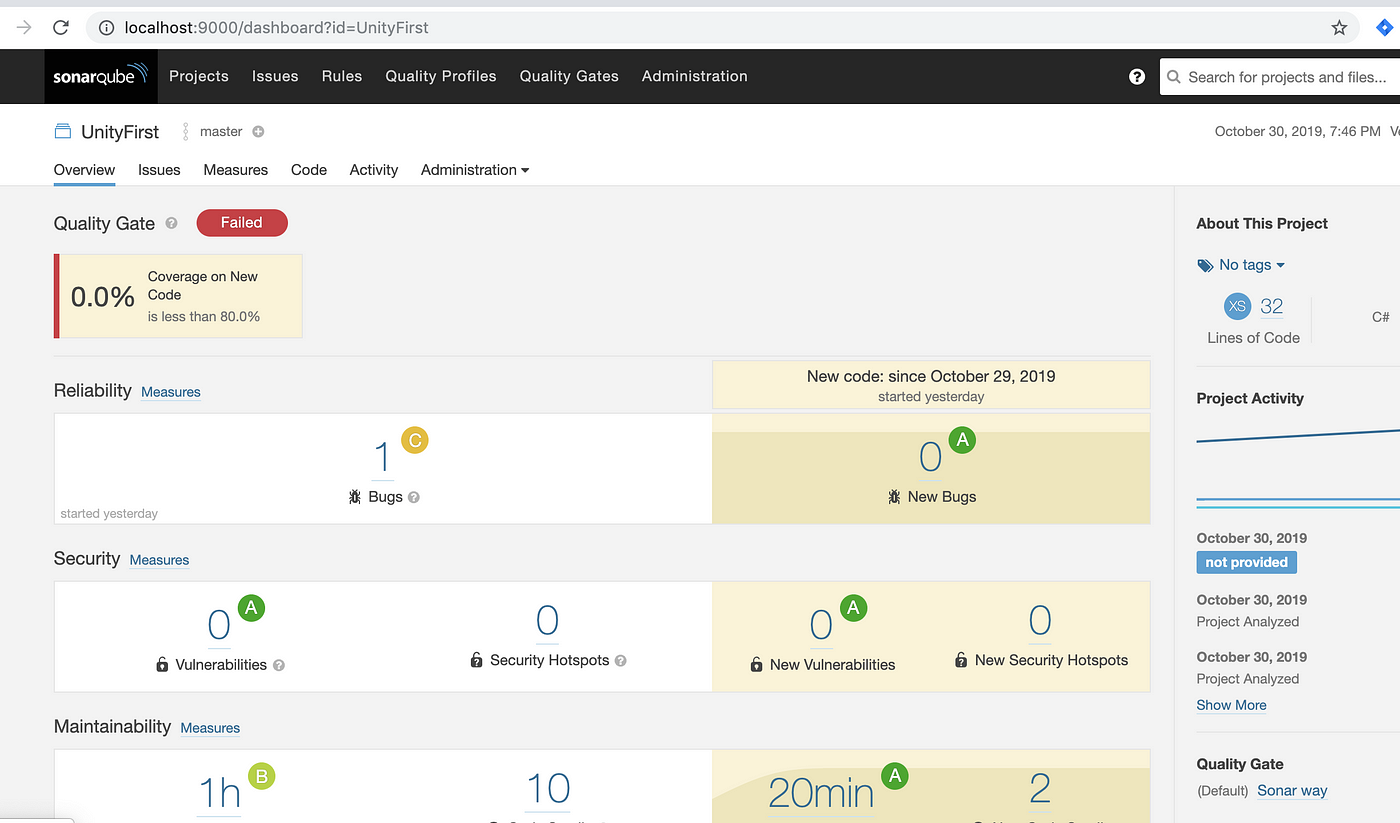
 We can further configure rules on sonar to include and exclude files and much more. Each of the analysis is also getting pushed to local sonar server

Conclusion
In this post, we have learned how to use SonarCube on a unity project in IDE.
This article was originally published on XR Practices Publication
#xr #unity #sonarqube #static code analysis #ide #tutorial #practice #technology