From Tap to Trace: Observability in KMP Applications
By Kuldeep Singh
- 6 minutes read - 1117 wordsIn an earlier article, I shared hands-on practices for building a cross-platform application using Kotlin Multiplatform (KMP) and Server-Driven UI (SDUI).
We built a simple application where the UI layout is fully controlled by the server, allowing Android and iOS experiences to evolve simultaneously without requiring frequent App Store or Play Store releases.
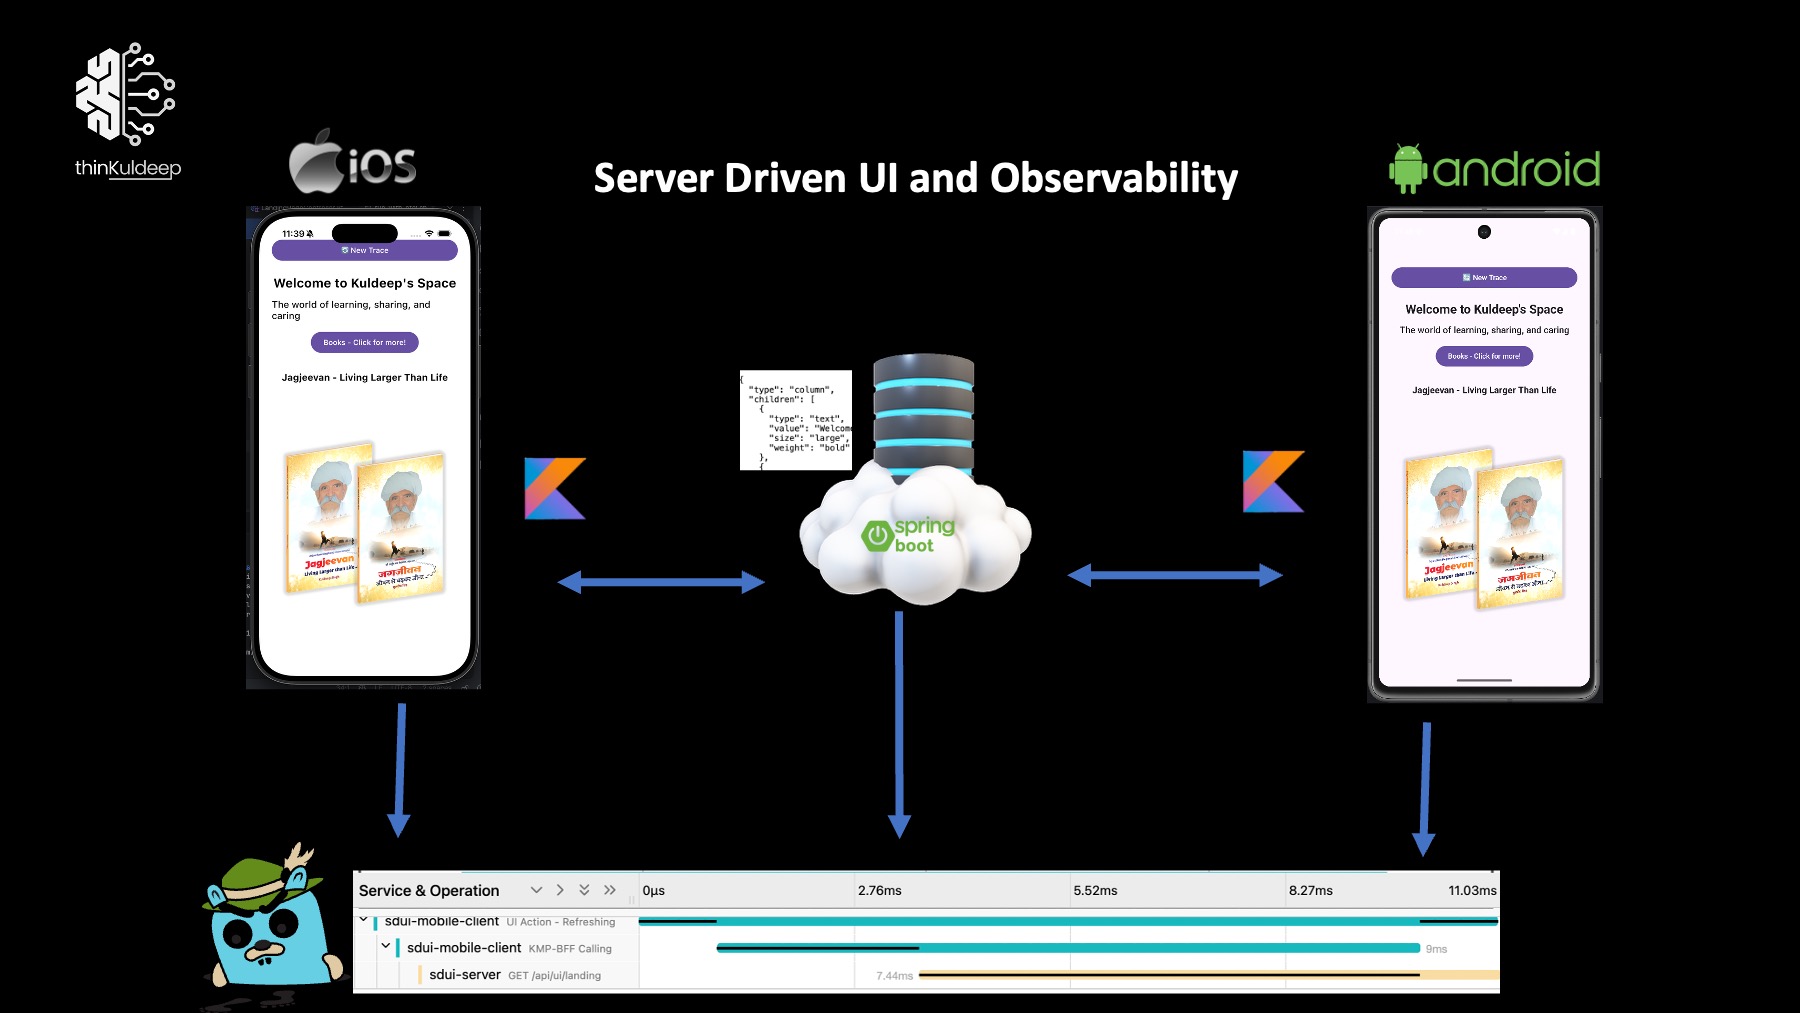
In this article, we will extend that application by implementing end-to-end observability, enabling us to monitor both mobile and server-side behavior in a single pane of glass using OpenTelemetry.
Understanding Observability
Once an application reaches production, building the product is only half the journey. The next challenge is understanding:
- How users interact with the application
- Where performance bottlenecks occur
- Which requests are failing
- How long journeys take across client and server
- Where latency, crashes, or memory issues originate
This is where observability becomes essential.
Modern distributed systems involve multiple layers: Mobile application, Backend, downstream services, datastore and more. When a user clicks a button, a single journey may span across all these layers.
A true observability solution allows us to visualize the entire journey as one trace, instead of fragmented logs across multiple systems.
This is what I refer to as a single pane of glass.
OpenTelemetry and W3C Trace Context
Fortunately, industry standards already exist:
- OpenTelemetry (OTel) — instrumentation and telemetry standard
- W3C Trace Context — standard HTTP propagation format {version}-{traceId}-{parentSpanId}-{sampleFlag}
- traceId - A 32-character hexadecimal identifier representing an entire distributed journey.
- spanId - A 16-character hexadecimal identifier represents a single operation.
- sampleFlag -
00/01- Indicates whether telemetry should be exported.
eg. 00-4bf92f3577b34da6a3ce929d0e0e4736-00f067aa0ba902b7-01
These standards make it possible for different technologies and tools to participate in the same distributed trace. For example, a trace can begin in:
- Kotlin mobile app
- Continue to Spring Boot BFF
- Propagate to GraphQL services
- End in New Relic, Jaeger, or another observability platform
All while preserving the same trace identity.
Sampling Matters
Telemetry comes with cost. In high-scale systems, exporting every request is often impractical.
Imagine:
- 100 million requests/day
- Average trace size = 500 bytes
- Daily ingestion ≈ 50 GB+
- Monthly ingestion ≈ several TB
That becomes expensive very quickly. Fortunately, for aggregate metrics:
1% sampled traffic often gives nearly the same trend visibility as 100%
That is why sampling is critical.
In this article we will cover: Trace generation, Span creation, Context propagation, Sampling. Exporting telemetry End-to-end distributed tracing
Prerequisites
You will need:
- KMP application setup (refer previous article)
- Spring Boot server with javaagent
- OpenTelemetry Java Agent
- Jaeger
Source code: 👉 https://github.com/thinkuldeep/SDUIPractices
1. Client Observability Setup
The SDUI client tracks:
- UI interactions
- HTTP requests
- Errors
- Performance spans
It propagates trace context to backend using W3C headers: traceparent, tracestate. Error spans are always exported, even if normal sampling is disabled.
1.1 Span Model
Span.kt : Represents a single operation in the trace
data class Span(
    val traceId: String,           // Unique trace identifier
    val spanId: String,            // Unique span identifier
    val parentSpanId: String? = null,
    val traceFlags: String = "01", // "01" = sampled, "00" = not sampled
    val name: String = "span",
    val startTime: Long,
    var endTime: Long? = null,
    var status: SpanStatus = SpanStatus.UNSET,
    var attributes: Map<String, String> = emptyMap()
)

enum class SpanStatus {
    UNSET, OK, ERROR
}
SpanContextHolder: Thread-safe holder for the current span context:
SpanContextHolder.current()   // Get current span
SpanContextHolder.set(span)   // Set current span
SpanContextHolder.clear()     // Clear context
1.2 Tracing Provider
TracingProvider.kt : Manages span lifecycle and export:
TracingProvider.startSpan(name, parentSpan)     // Create child span
TracingProvider.endSpan(span, status)           // End and export span
TracingProvider.recordError(span, error)        // Record error on span
Error Handling: :
- add error metadata
- set span status to ERROR
- Export immediately
2. Sampling Strategy
We use environment-based sampling.
- QA/QA Users/Development- 100%
- Stage - 20%
- Production - 1%
data class SamplingConfig( val environment: Environment = Environment.QA, val isQaUser: Boolean = false) {
    fun shouldSample(): Boolean = when {
        isQaUser -> true
        environment == Environment.QA -> true
        environment == Environment.STAGING -> Random.nextDouble() < 0.2
        environment == Environment.PRODUCTION -> Random.nextDouble() < 0.01
        else -> true
    }

    fun getTraceFlags(): String = if (shouldSample()) "01" else "00"
}
3. Exporting to Jaeger
We export spans using OTLP.
interface SpanExporter {
    suspend fun export(spans: List<Span>)
    fun shutdown()
}
JaegerSpanExporter - Jaeger Implementation :
class JaegerSpanExporter() : SpanExporter {
    override suspend fun export(spans: List<Span>) {
        val spansToExport = spans.filter { it.traceFlags == "01" || it.status == SpanStatus.ERROR }
        if (spansToExport.isEmpty()) {
            return
        }
        try {
            val payload = buildJaegerPayload(spansToExport)
            httpClient.post(PlatformConfig.exportEndpoint) { contentType(ContentType.Application.Json)setBody(payload) }
        } catch (e: Exception) {
            println("❌ [JAEGER] Failed to export spans: ${e.message}")
        }
    }
}
Notice:
Sampled spans are exported
Error spans are always exported
4. Application Initialization
object AppInitializer {
    fun initializeApp(environment: Environment = DEVELOPMENT, isQaUser: Boolean = false) {
            val config = SamplingConfig(environment, isQaUser)
            SamplingConfig.setCurrent(config)
            TracingProvider.initialize(JaegerSpanExporter(...))
        }
    }
}
Android : MainActivity
class MainActivity : ComponentActivity() {
    override fun onCreate(savedInstanceState: Bundle?) {
        super.onCreate(savedInstanceState)
        AppInitializer.initializeApp(Environment.PRODUCTION)
    }
}
iOS : MainViewController
fun MainViewController() = ComposeUIViewController {
    val vm = remember {
        AppInitializer.initializeApp(Environment.PRODUCTION)
        LandingViewModel()
    }
        ...
}
5. Observability at UI Layer
When user clicks Refresh:
fun refreshUI(viewModel: LandingViewModel) {
    var span = Span.create()
    SpanContextHolder.set(span)

    span = TracingProvider.startSpan(name = "UI Action - Refreshing", span)
    viewModel.setSpan(span)
    viewModel.reload()
}
Complete span after operation:
fun reload(){
    try {
        val root = repository.fetchLanding()
        originalTree = root
        _uiState.value = applyFeatureFilter(root)
        SpanContextHolder.current()?.let { TracingProvider.endSpan(it) }
    } catch (e: Exception) {
        recordError(e)
    }
}
6. Observability During HTTP Calls
We instrument Ktor client.
onRequest { request ->
    requestSpan = TracingProvider.startSpan("KMP-BFF Calling", SpanContextHolder.current())
    request.headers["traceparent"] = requestSpan.toTraceparent()
    request.attributes.put(SPAN_ATTRIBUTE, requestSpan)
}

onResponse { response ->
    val requestSpan = response.call.request.attributes.getOrNull(SPAN_ATTRIBUTE)
    requestSpan?.let {
        val status = if (response.status.value >= 400) SpanStatus.ERROR else SpanStatus.OK
        TracingProvider.endSpan(it, status)
    }
}
Now both Android and iOS automatically propagate trace context to backend.
7. Installing Jaeger
Run Jaeger locally. Ref link
$  curl -L https://github.com/jaegertracing/jaeger/releases/download/v1.52.0/jaeger-1.52.0-darwin-amd64.tar.gz -o jaeger.tar.gz
$ tar xzf jaeger.tar.gz
$ ./jaeger-all-in-one
Open: http://localhost:16686
OTLP endpoint: http://localhost:4318/v1/traces
8. Server-Side Observability
Enable OpenTelemetry in Spring Boot.
otel.sdk.disabled=false
otel.traces.sampler=parentbased_traceidratio
otel.traces.sampler.arg=0.01

otel.exporter.otlp.endpoint=http://localhost:4318
otel.exporter.otlp.traces.endpoint=http://localhost:4318/v1/traces
otel.traces.exporter=otlp
otel.service.name=sdui-server
This configuration:
- Respects parent sampling decision
- Samples 1% of unsampled incoming traffic
Run with Java agent:
java -javaagent:opentelemetry-javaagent.jar -jar app.jar
This automatically instruments:
- HTTP APIs
- Spring MVC
- Database calls
- Outbound HTTP calls
No manual instrumentation required for most backend flows.
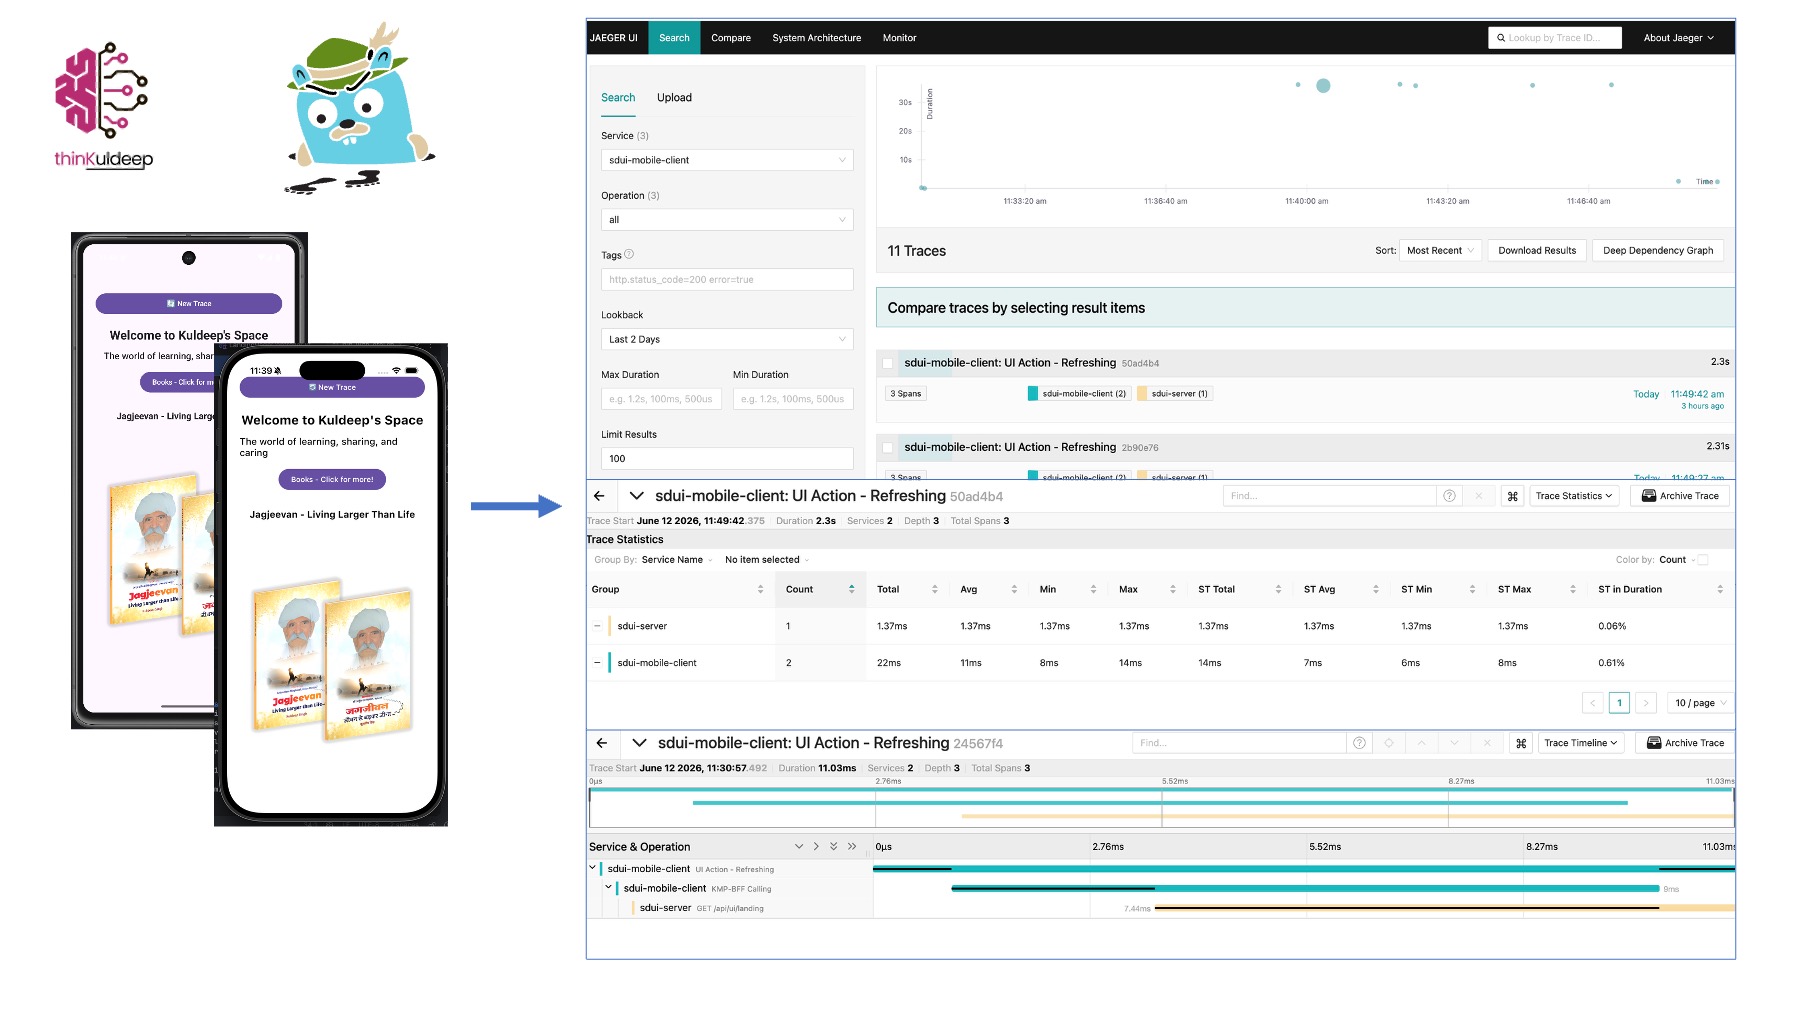
Running End-to-End Observability
- Start Jaeger
- Start Spring Boot with Java Agent
- Run Android or iOS app
- Click New Trace
- Observe full trace in Jaeger UI
- Experiment with different sampling environments
You will now see:
Mobile UI
↓
KMP HTTP Client
↓
Spring Boot BFF
↓
Downstream Services
all as a single distributed trace.
Final Thoughts
Observability is not just about collecting logs. It is about understanding the complete user journey across distributed systems.
Kotlin Multiplatform makes cross-platform development easier. OpenTelemetry makes cross-platform observability possible.
Together, they provide a powerful foundation for building highly observable mobile systems.
Keep learning. Keep building. Keep sharing.
#kotlin-multiplatform #kotlin #enterprise #integration #technology #interoperability #mobile #android #iOS #Unity #Observability #OTel #Telemetry